
An enterprise-grade IoT-based smart Power Monitoring System is engineered to deliver real-time visibility into energy usage across commercial, educational, and industrial facilities. The scalable, cloud-enabled solution serves as a centralized IoT energy monitoring system that tracks over 2,500 data points, offering actionable insights through intuitive dashboards, socket-based updates, and advanced analytics. Designed for facility managers and energy teams, this smart energy monitoring system using IoT supports custom reporting, MQTT integration, and device-level grouping. Whether reducing costs or driving sustainability, this energy monitoring system using IoT empowers smarter, data-driven energy decisions across every floor, zone, or building.

Businesses faced excessive utility expenses due to unmonitored and inefficient power consumption patterns. Without optimization tools, energy waste went unnoticed, directly impacting the bottom line through inflated operational overheads.
The absence of real-time tracking made it impossible to detect sudden spikes or unusual usage. This led to ongoing, unnoticed energy wastage and missed opportunities for timely intervention or system tuning.

Facilities lacked a unified view to compare energy usage by floors, zones, or equipment. This gap hindered energy audits, making it difficult to identify underperforming areas or justify energy-saving investments.

Without granular reports on consumption, many struggled with meeting regulatory requirements or making data-backed decisions for efficiency improvements, especially in environments with strict energy compliance needs.

In the absence of live alerts, decision-makers couldn’t react promptly to abnormal consumption behaviors, increasing the risk of equipment failure, inefficiency, or unnoticed operational leaks in energy usage.

Managing electric, solar, and water data separately across systems created inefficiencies. The lack of a centralized platform made it challenging to get a holistic view and streamline energy operations.

Systems lacked flexible, role-based access, limiting tailored views for technicians, managers, and admins. This led to confusion, bottlenecks, and lack of accountability in large or multi-site energy management teams.
To address these challenges, we developed a real-time, IoT-enabled Power Management System that brings together data from thousands of power meters and sensors into a single, intuitive platform. This solution doubles as an IoT Based Power Quality Monitor System, helping organizations gain precision in tracking and controlling their utility usage.

Gain unified access to over 2,500 real-time data points collected from various meters including electricity, water, gas, steam, and solar. This centralized IoT energy monitoring system eliminates silos and supports cross-utility visibility under one platform.

Generate customizable reports at 10-minute, 30-minute, hourly, daily, or monthly intervals. Export insights in PDF or CSV formats to track historical consumption, identify inefficiencies, and meet compliance and auditing requirements with precision and ease.

Configure secure, role-based access for building administrators, facility managers, and analysts. This granular control ensures each user only accesses relevant data and tools, enhancing operational security and focused decision-making across departments and locations.

Ensure data continuity with system-wide backup and restore functionality. The platform supports automated backups, error recovery, and full restoration processes, protecting critical insights and minimizing downtime during technical issues or system upgrades.

Visualize energy usage, carbon footprint, and cost metrics with interactive charts such as gauges, bar graphs, line plots, and pie charts. These real-time dashboards empower stakeholders to interpret trends and optimize energy performance instantly.

Leverage WebSockets and MQTT protocol for continuous real-time updates. The smart energy monitoring system using IoT ensures immediate access to live consumption data, enabling informed decisions and rapid responses to anomalies or operational irregularities.

Organize meters and devices by buildings, floors, zones, and departments for structured analytics. This hierarchy enables targeted performance insights and streamlined management of the entire energy monitoring system using IoT.

Track energy consumption in real time using IoT from over 2,500 connected power meters and environmental sensors. This smart energy monitoring system using IoT enables instant visibility, helping facilities proactively reduce waste and improve efficiency.

Access energy data at every organizational level—building, floor, zone, group, or device. This multi-layered structure ensures contextual insights for every stakeholder, from corporate sustainability teams to local building managers.

Visualize usage and trends with configurable dashboards featuring gauge meters, line charts, bar graphs, pie charts, and odometers. Users can monitor consumption and cost patterns intuitively, tailored to their preferences and operational needs.

Generate detailed reports at customizable intervals—10 minutes, 30 minutes, hourly, daily, or monthly. This feature ensures timely insights for audits, performance evaluations, and energy-saving initiatives across departments.

Export data-rich reports in PDF or CSV formats. Choose from a single-page overview or full dataset exports for sharing, compliance tracking, or deeper analysis of your energy footprint.

Ensure uninterrupted real-time updates through MQTT and WebSocket integration. These technologies keep dashboards and data views live, empowering instant decision-making based on current energy metrics.

Control platform access securely with role-based permissions for Admins, Analysts, and Viewers. This ensures users see only relevant data while maintaining compliance, governance, and confidentiality across organizational tiers.

Easily manage all IoT-connected devices through a unified sensor management module. Instantly view sensor types, status, and connectivity to ensure smooth operations across your energy monitoring infrastructure.

Organize and categorize devices using a drag-and-drop interface. This flexible structure enhances usability, simplifies analytics, and supports expansion into new facilities or meter types with minimal setup.

Receive instant alerts for energy spikes, anomalies, or threshold breaches. This feature helps teams respond quickly, prevent overconsumption, and maintain operational stability through proactive energy management.

Safeguard critical energy data with secure backup and restore features. Supports large data sets and memory-safe processing, ensuring business continuity and rapid recovery from unexpected issues.

Design your own dashboards using a Gridster2-based layout builder. This flexibility allows users to create tailored views that align with their operational focus and energy tracking priorities.

Monitor voltage fluctuations, harmonics, and load imbalances with complete power quality analytics. This capability improves equipment protection, reduces downtime, and enhances visibility across the smart energy monitoring system using IoT.

Built as a modular, scalable IoT based energy monitoring system, the platform adapts to growing enterprise needs across multi-site, multi-utility environments with ease, performance, and reliability.

Angular 15

Socket.IO

MQTT Broker

MongoDB
NestJS

HighCharts

AmCharts

Chart.js

Odometer

Gauge.js

Angular Material

Gridster2

PrimeNG

ngx-daterangepicker-material

ngx-toastr

Angular Tree

Context Menu

jspdf

Middleware-based secure auth

NGXS

Docker

AWS

Grafana

The IoT based smart power monitoring system accelerates anomaly detection by 70%, enabling facility managers to identify irregularities and prevent energy loss or equipment failure in near real time across all monitored zones.

Through granular monitoring and intelligent reporting, the platform helps reduce unnecessary energy consumption by up to 35%, supporting sustainability goals while significantly lowering operational costs in large-scale commercial or industrial environments.

Automated data collection and customizable scheduling reduce the reporting cycle by 40%. Teams can now generate detailed compliance, consumption, and performance reports in minutes, enhancing efficiency and audit readiness.

With live data, predictive insights, and actionable visualizations, stakeholders gain the clarity needed to make informed operational decisions—improving performance, maintenance planning, and energy-saving initiatives across the organization.

Track and compare data across multiple facilities, floors, or zones with a centralized view. This visibility enables smarter resource allocation and helps uncover patterns that drive strategic improvements and long-term sustainability.

Automated tracking and digital records eliminate the need for paper-based or spreadsheet logging. Teams save time, reduce errors, and maintain reliable historical data for analysis and compliance effortlessly.

Role-based dashboards and interactive charts increase stakeholder engagement by making energy data accessible and meaningful. Teams stay informed and motivated to achieve energy goals through real-time, personalized insights.

Secure, scalable healthcare practice management software for allied health clinics, streamlining scheduling, billing, and patient care.

Discover trusted medical treatment abroad with our medical tourism platform, offering secure bookings, consultations, and global care coordination.

Streamlined behavioral health billing with cloud-based RCM software, AI-driven claims management, and real-time insurance integration.

Cloud-based EMR and behavioral health EHR with patient engagement software, HIPAA compliant portal, and secure healthcare analytics for better care delivery.

HIPAA-compliant SaaS healthcare platform unifying IoT in healthcare, RPM, and automated reporting for chronic disease and public-health programs.

HIPAA-compliant telehealth physical therapy platform with remote patient monitoring, guided rehab, and analytics to improve MSK recovery outcomes.

Scalable wellness app development with appointment scheduling API, secure user authentication, and health metrics dashboard for measurable outcomes.

Explore remote patient monitoring software for chronic care, behavioral health, and transitional care compliant, scalable, and patient-focused.

HIPAA-compliant AI telehealth app with computer vision for MSK care, real-time motion tracking, pain mapping, and remote patient monitoring.

AI-powered mental wellness app with 24/7 emotional support, mood tracking, habit coaching, and secure analytics for scalable mental health care.
Streamline care delivery with healthcare management software integrating medical billing, workforce tracking, and revenue cycle automation.

HIPAA-compliant behavioral health EHR software streamlining clinical, billing, and intake workflows for mental health, recovery, and human services providers.

A scalable cloud-based claims administration platform for TPAs, insurers, and Medicare providers—streamlining onboarding, processing, and analytics.

Custom cloud-based fitness app with virtual coaching, workout tracking, nutrition plans, and goal-driven features for trainers, users, and admins.

We built a secure, scalable telehealth app with remote patient monitoring for Australian healthcare—delivering virtual consultations, billing, and compliance.

Eco-friendly affiliate marketing software enabling carbon-neutral shopping, coupon savings, and real-time carbon emission tracking at scale.

Discover a cloud-based POS and retail ERP system unifying HR, inventory, ticketing, and training—built for multi-store retail business efficiency.
Scalable SaaS gift registry platform for nonprofits, delivering charity gifting software solutions with secure payments and rural development impact.
Boost florist sales with our SaaS eCommerce platform for B2B & B2C. POS, CRM, and mobile tools streamline operations and enhance customer retention.
Cloud-based tanning salon software with POS, booking, automation, and analytics to streamline operations and boost customer retention.
.png)
Cyclist-first marketplace with events, bike-friendly lodging, and gear shops—built with Laravel for scalable vacation rental app development services.

Cloud-based CRE marketing software with online real estate BOV module, MLS integration, and marketing automation for faster property deals.

Streamline rentals with tenant management software, AI in property management, and proptech software development for smarter real estate operations.

Discover our scalable virtual learning platform development with real-time classes, session management dashboard, and learning management system services.

Custom online lesson planner and eLearning platform for K–12 & higher ed—curated content, student tagging, and reusable templates for impactful teaching.

Modular academic advising software and degree planning tool with ERP integration, secure role-based access, and real-time course scheduling.

AI-powered online education platform with interactive eTextbooks, adaptive assessments, and real-time analytics to boost engagement and readiness.
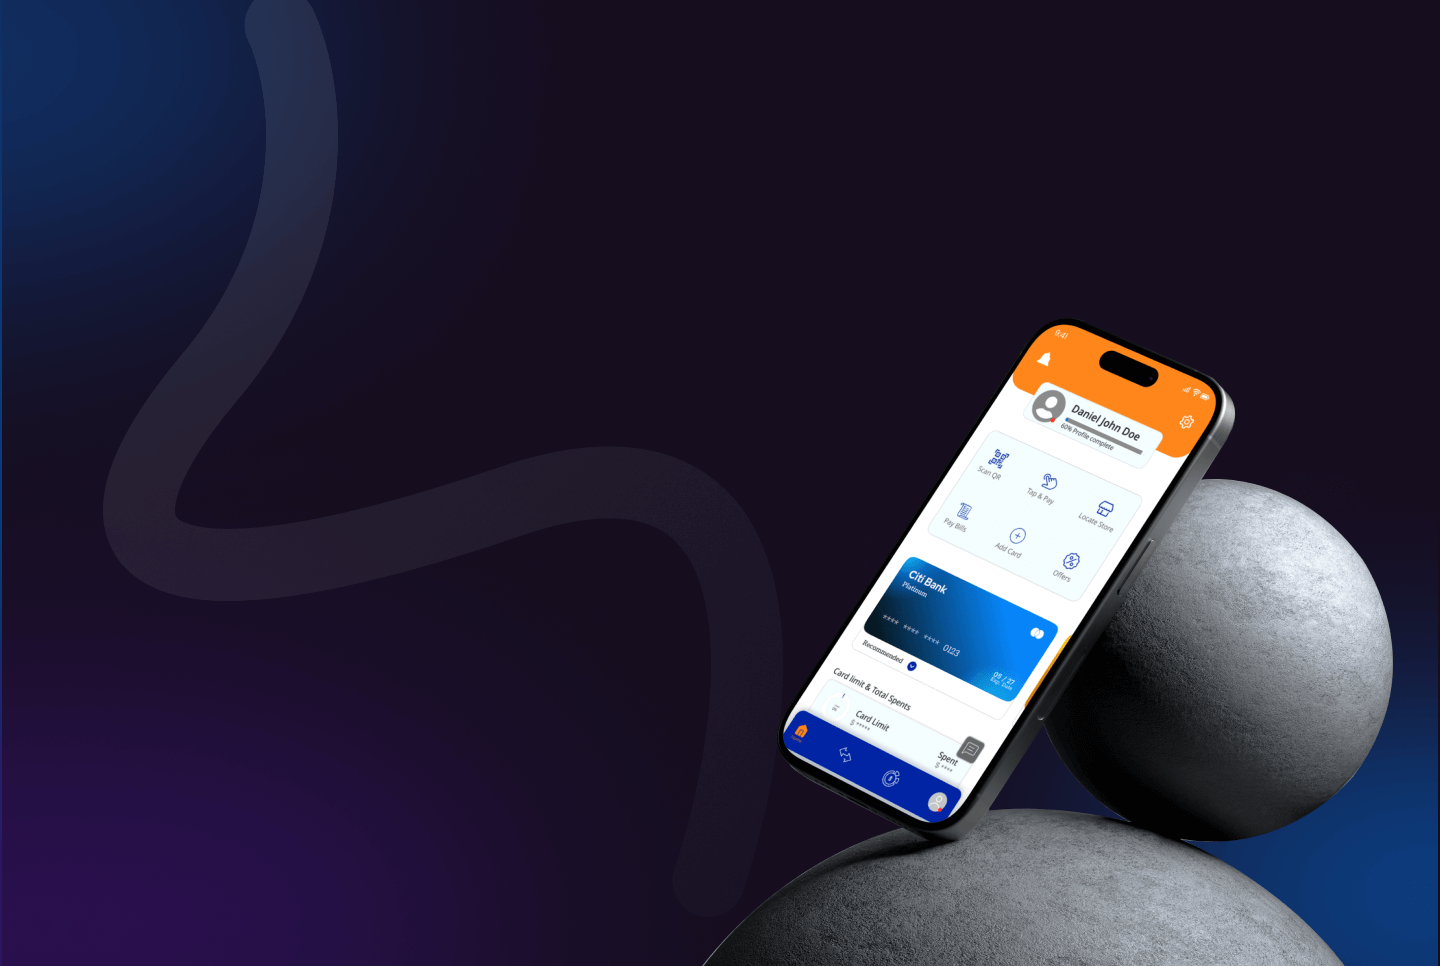
All-in-one employee engagement platform uniting communication, learning, and recognition to boost productivity and collaboration in modern workplaces.
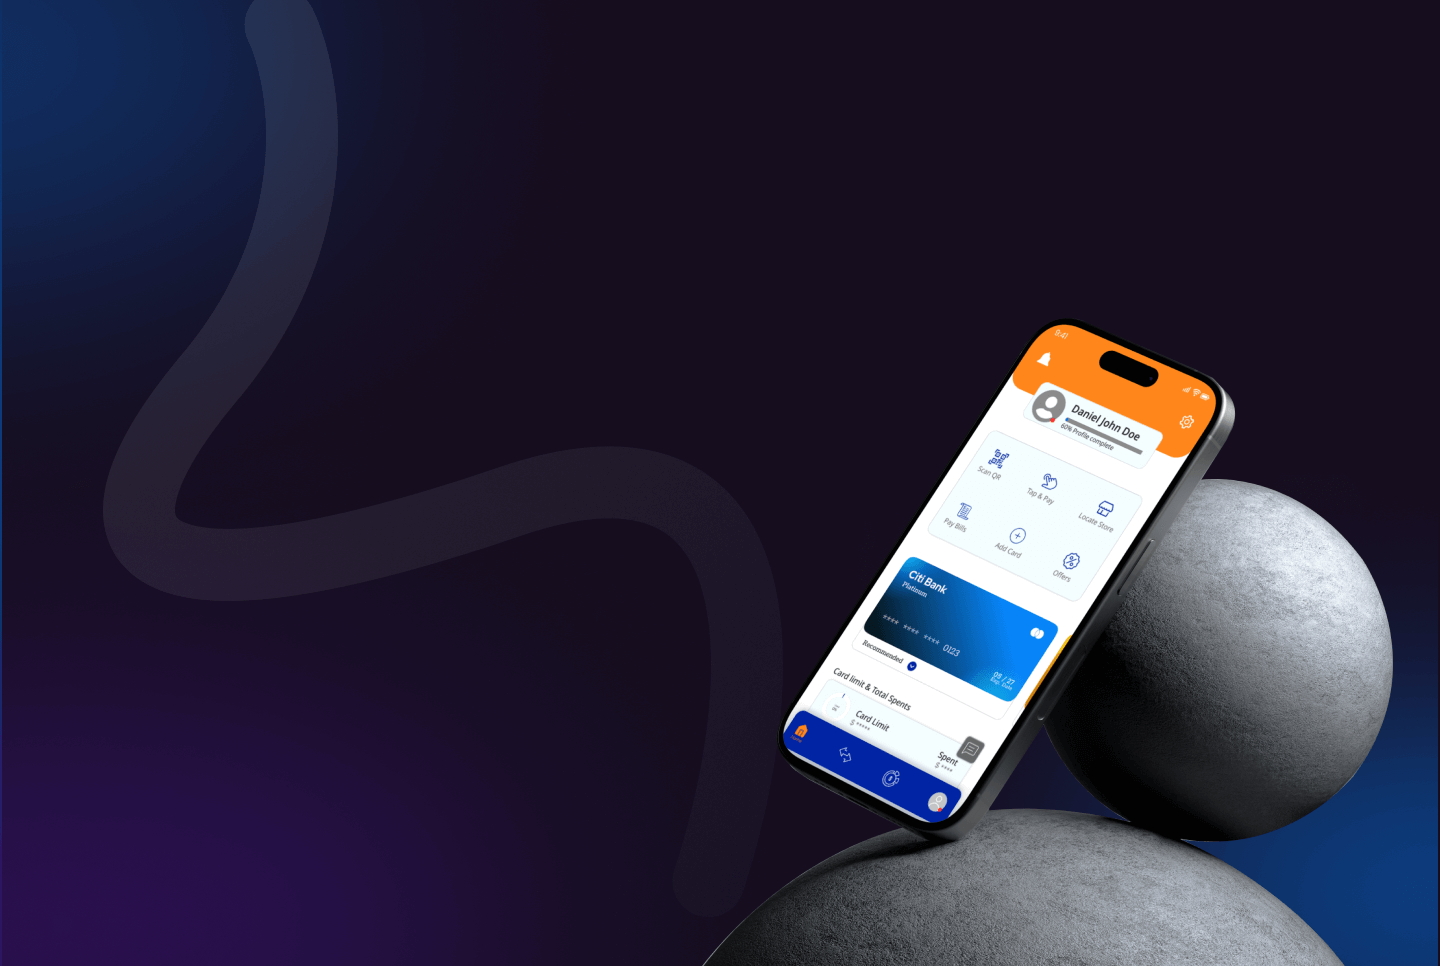
Automated B2B invoicing software with recurring billing, real-time tracking, and Azure serverless architecture for secure, scalable operations.
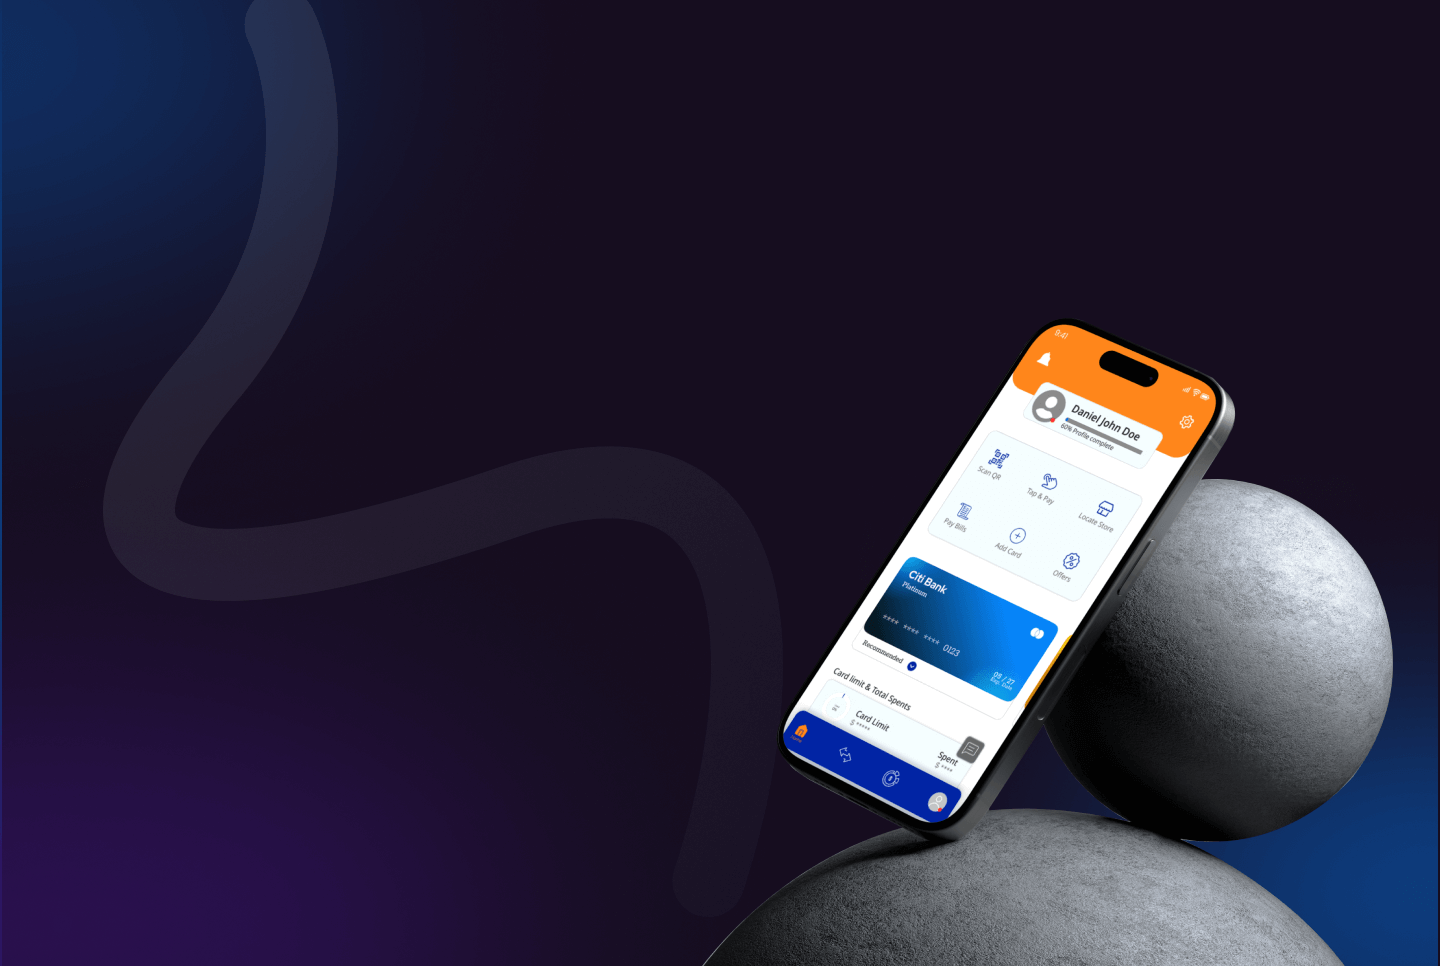
End-to-end digital lending platform with BNPL, auto lease software, and Arabic localization, built by a leading fintech software development company.
Scalable fintech app for currency exchange, forex cards, and remittances—delivering automation, compliance, and real-time global transactions.
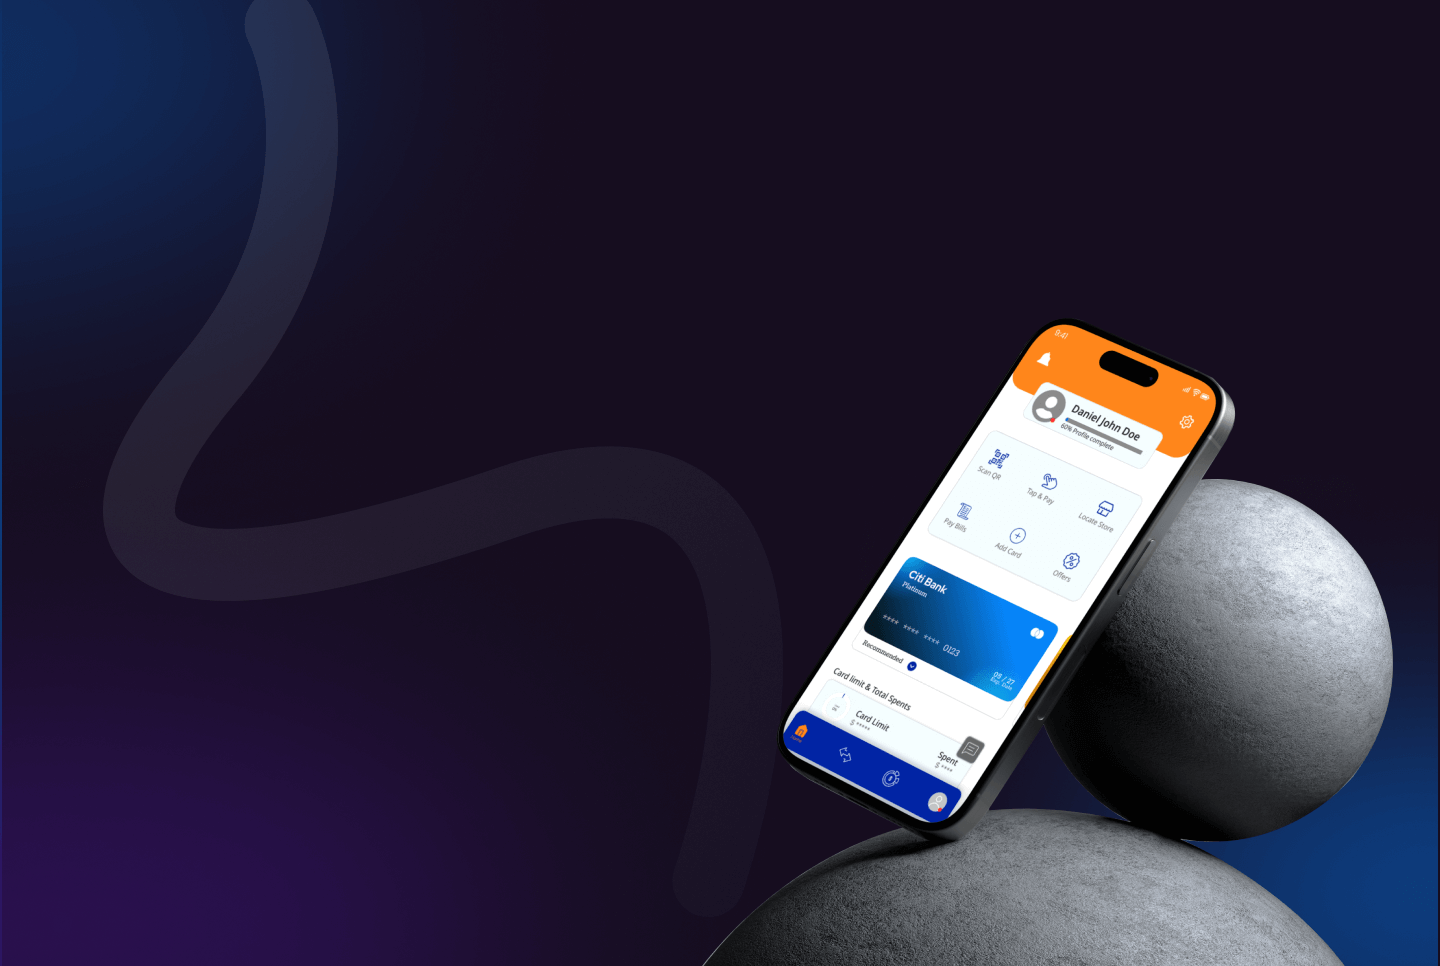
Custom fintech app unifying 100+ services into a B2B/B2C fintech solution with real-time visibility and automated workflows.
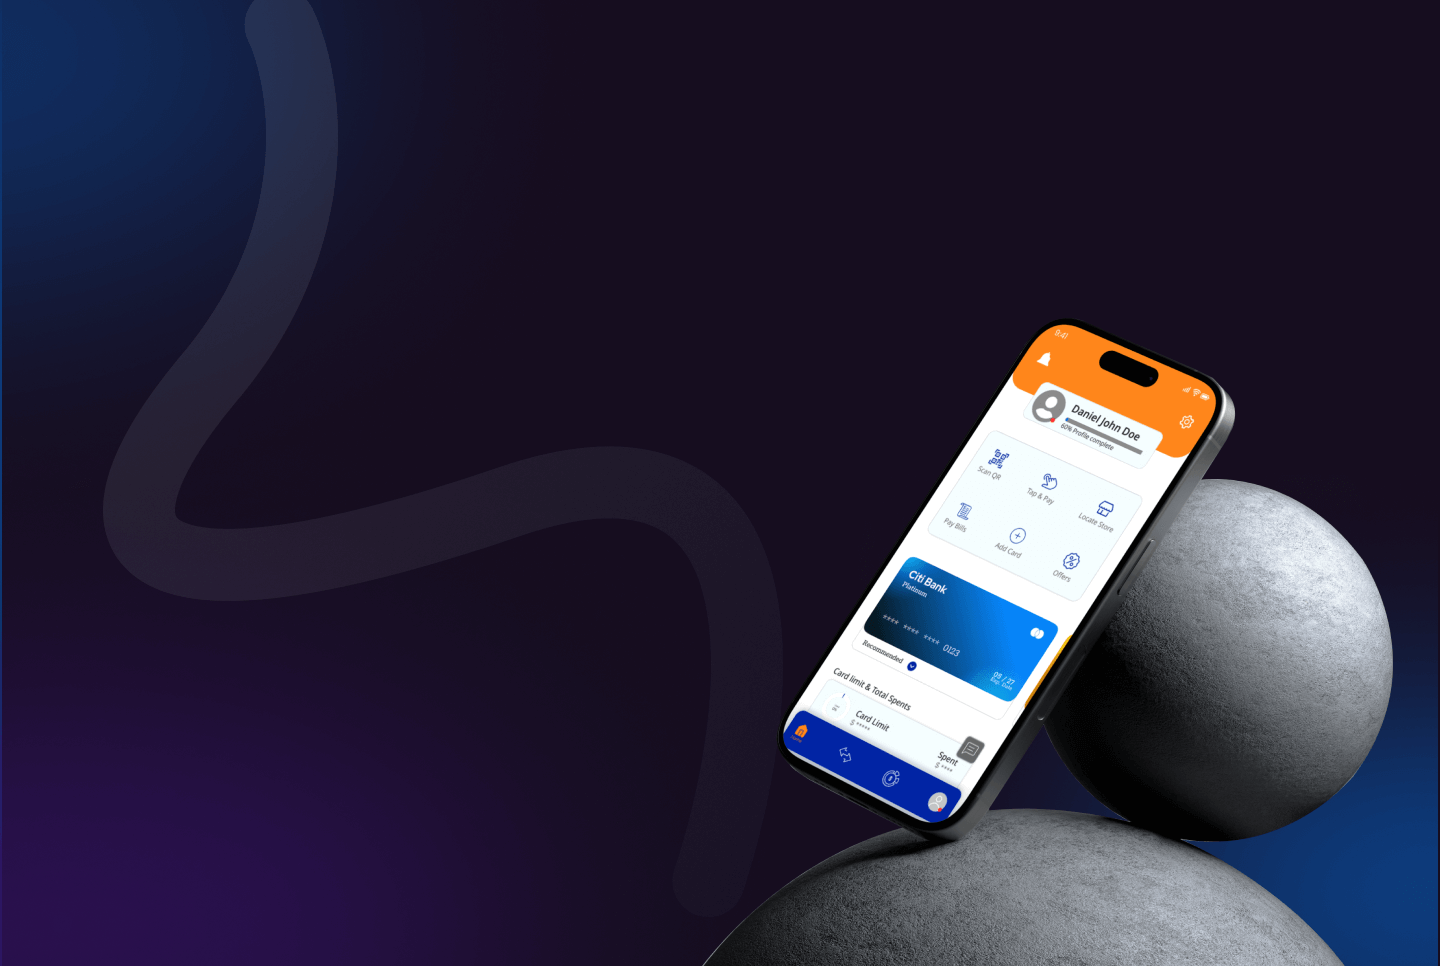
Enterprise platform for automated trade data ingestion. Multi vendor marketplace development and service marketplace app development with Snowflake & Salesforce.

Secure cross border payment platform with digital wallet app, invoicing, subscriptions, and ML-based fraud detection for global businesses.

Discover a SaaS fintech platform on Azure that streamlines loan management, lender integration, and financing workflows, delivering instant approvals and enhanced customer experience.

Auto claims management software with parts procurement, BI analytics, and workflow automation to streamline insurance repairs and supplier collaboration.
Responsible sourcing software with ESG compliance tools, human rights due diligence, and supply chain transparency to improve worker engagement.
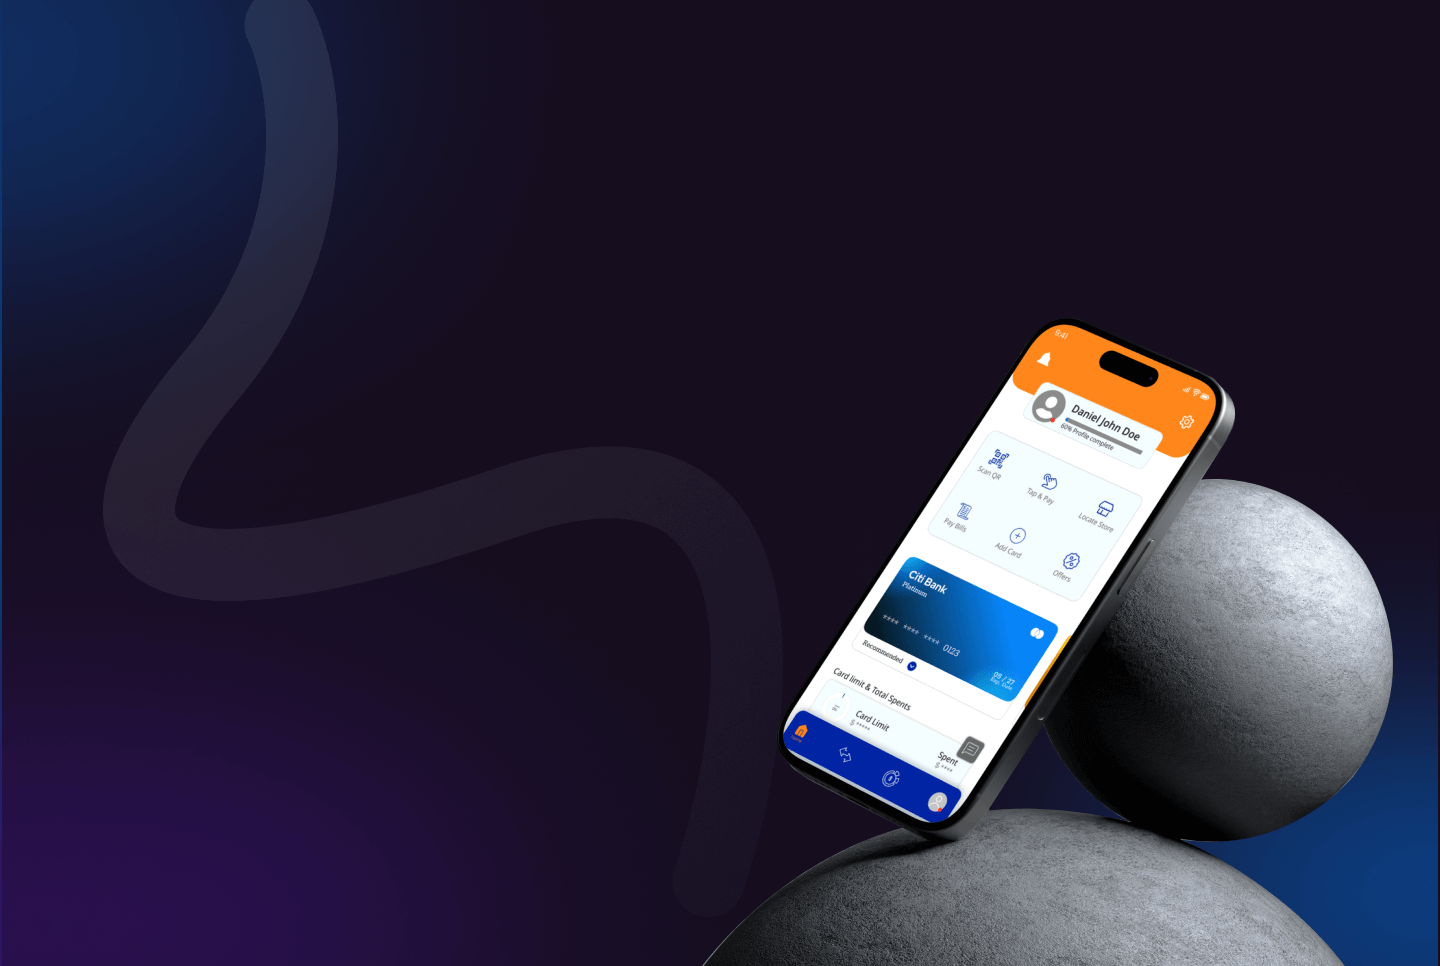
Automotive lending software automating dealer loan workflows with real-time integrations, fee validation, and instant approvals for faster financing.
Automated rental management system with online rental booking software to boost efficiency, bookings, and customer experience for rental businesses.
End-to-end truck repair management software with automation, digital vehicle inspections, and multi-branch scalability for auto repair businesses.
Discover how our SMS automation software and referral marketing platform helped small businesses boost acquisition, loyalty, and ROI.

Digital customs document clearance software for freight forwarders with real-time tracking, automation, and compliance-ready solutions.

Custom AI face recognition software with biometric security, legal takedowns, and verified access to safeguard digital privacy and identity.
Built a real-time payment analytics platform for the Govt aided platforms with workflow automation solutions and multilingual workflow automation capabilities.

Cloud-based CRE marketing software with online real estate BOV module, MLS integration, and marketing automation for faster property deals.
Enterprise SaaS for automated billing with RBAC implementation and single sign-on integration, boosting accuracy, governance, and global finance workflows.
AI-driven legal document automation software with clause libraries, logic management, and CLM integration—boosting accuracy, compliance, and speed.

Streamline rentals with tenant management software, AI in property management, and proptech software development for smarter real estate operations.

Streamlined behavioral health billing with cloud-based RCM software, AI-driven claims management, and real-time insurance integration.

Cloud-based EMR and behavioral health EHR with patient engagement software, HIPAA compliant portal, and secure healthcare analytics for better care delivery.

Auto claims management software with parts procurement, BI analytics, and workflow automation to streamline insurance repairs and supplier collaboration.

Cloud-based tanning salon software with POS, booking, automation, and analytics to streamline operations and boost customer retention.
Azure-hosted court case management software enabling secure workflows, real-time data sync, and streamlined inter-agency coordination.
Real-time whale sightings app and whale alert system using advanced marine conservation technology for ocean wildlife protection and tracking.

Automated B2B invoicing software with recurring billing, real-time tracking, and Azure serverless architecture for secure, scalable operations.

Scalable wellness app development with appointment scheduling API, secure user authentication, and health metrics dashboard for measurable outcomes.

Enterprise SaaS IoT asset tracking software for security operations with real-time monitoring, incident reporting, and mobile-ready dashboards.
Modernize urban mobility with our smart parking management system. Explore intelligent parking solutions for cities to streamline tracking, payments & enforcement.

All-in-one employee engagement platform uniting communication, learning, and recognition to boost productivity and collaboration in modern workplaces.
A creative scorebook collaboration platform with real-time notation, event integration, and multi-device access—built for musicians, educators, and ensembles.
We developed a construction safety management platform with real-time risk tracking, gamification, and offline access for high-risk industries.

AI-powered marijuana detection device with VR-based eye tracking, automated sobriety test workflows, and secure video processing for compliance.

AI-powered smart farm monitoring system with ammonia sensor barn tracking, real-time alerts, and predictive insights for safer, compliant operations.
A centralized SaaS platform for motorcycle and powersports dealers—streamlining sales, financing, insurance, and trade-ins for faster deal closures.
Scalable custom SaaS platform with AI advisor matching, enterprise CRM tools, and high-speed search for global expert consultations.

Streamline care delivery with healthcare management software integrating medical billing, workforce tracking, and revenue cycle automation.
Scalable B2B travel portal development integrating flights, hotels & tours with real-time booking. Built for global travel software companies.
Secure business workflow automation software integrating offender case management, financial account handling, and digital process automation services.
Discover RoadSight, a custom-built travel assistance software and an AI-powered, voice-first travel and tourism app for safer, smarter, hands-free exploration.
SaaS-based event ticketing software development with secure seat selection, Stripe payments, and real-time check-ins for modern online event management.

Eco-friendly affiliate marketing software enabling carbon-neutral shopping, coupon savings, and real-time carbon emission tracking at scale.
A secure, mobile-first offender management platform designed for pre-release and community corrections, enabling real-time tracking, secure communication, and treatment plan access to improve compliance, transparency, and rehabilitation outcomes across correctional facilities.

Enterprise platform for automated trade data ingestion. Multi vendor marketplace development and service marketplace app development with Snowflake & Salesforce.
Cloud-based SaaS asset management software with real-time alerts, predictive analytics, and reporting to replace manual tracking and boost efficiency.
A secure, mobile-first offender case management platform with GPS tracking, secure messaging, and automation to boost compliance and transparency.

Discover a SaaS fintech platform on Azure that streamlines loan management, lender integration, and financing workflows, delivering instant approvals and enhanced customer experience.

Discover a cloud-based POS and retail ERP system unifying HR, inventory, ticketing, and training—built for multi-store retail business efficiency.
ASAM-based addiction management software for treatment centers. Streamline substance abuse treatment with structured care plans and integrated billing.
Cloud-based tour booking platform with AI-driven tools for fishing charters, hiking tours, and guides. Secure payments, scalability, and growth-ready SaaS.
.png)
Cyclist-first marketplace with events, bike-friendly lodging, and gear shops—built with Laravel for scalable vacation rental app development services.
A secure, scalable Peer to Peer Rental Marketplace enabling local item sharing, reducing waste, and empowering communities to monetize idle assets with safe, intuitive rental workflows and smart transaction controls.
Scalable UGC marketplace app with escrow, FedEx, licensing & analytics—built by an expert marketplace app development company for secure brand-creator campaigns.

Discover crowdfunding app development with donation matching, SaaS dashboards, and recurring memberships for nonprofits and crowdfunded.
A smart parking solutions with real-time search, booking, and payments. Scalable parking management system for drivers, hosts, and admins.

Automated rental management system with online rental booking software to boost efficiency, bookings, and customer experience for rental businesses.

Discover our scalable virtual learning platform development with real-time classes, session management dashboard, and learning management system services.

Enterprise platform for automated trade data ingestion. Multi vendor marketplace development and service marketplace app development with Snowflake & Salesforce.

Custom cloud-based fitness app with virtual coaching, workout tracking, nutrition plans, and goal-driven features for trainers, users, and admins.

Cloud-based tour booking platform with AI-driven tools for fishing charters, hiking tours, and guides. Secure payments, scalability, and growth-ready SaaS.

HIPAA-compliant on-demand marketplace for therapy with real-time scheduling, secure profiles, and scalable open-source software for therapists.

Discover trusted medical treatment abroad with our medical tourism platform, offering secure bookings, consultations, and global care coordination.

Digital customs document clearance software for freight forwarders with real-time tracking, automation, and compliance-ready solutions.

Cloud-native IoT tracking system with GPS, video intelligence, and remote device control for scalable, future-ready asset management across industries.

IoT-based energy monitoring system using smart power quality analytics for real-time tracking, cost savings, and sustainability in facilities.

Smart IoT lighting and HVAC control system with QR code access control and real-time energy management for efficient building operations.

Enterprise SaaS IoT asset tracking software for security operations with real-time monitoring, incident reporting, and mobile-ready dashboards.

Modernize urban mobility with our smart parking management system. Explore intelligent parking solutions for cities to streamline tracking, payments & enforcement.

IoT-driven smart greenhouse automation with climate control, soil moisture sensors, and Hortimod OS for precision agriculture and higher yields.

AI-powered smart farm monitoring system with ammonia sensor barn tracking, real-time alerts, and predictive insights for safer, compliant operations.

Cloud-native IoT tracking system with GPS, video intelligence, and remote device control for scalable, future-ready asset management across industries.

Discover IoT-based smart water management system development services for real-time monitoring, supply control, and scalable smart city solutions.

Explore remote patient monitoring software for chronic care, behavioral health, and transitional care compliant, scalable, and patient-focused.

HIPAA-compliant SaaS healthcare platform unifying IoT in healthcare, RPM, and automated reporting for chronic disease and public-health programs.

Automotive lending software automating dealer loan workflows with real-time integrations, fee validation, and instant approvals for faster financing.

A centralized SaaS platform for motorcycle and powersports dealers—streamlining sales, financing, insurance, and trade-ins for faster deal closures.

We developed a construction safety management platform with real-time risk tracking, gamification, and offline access for high-risk industries.

IoT-based energy monitoring system using smart power quality analytics for real-time tracking, cost savings, and sustainability in facilities.

Smart IoT lighting and HVAC control system with QR code access control and real-time energy management for efficient building operations.

Discover IoT-based smart water management system development services for real-time monitoring, supply control, and scalable smart city solutions.

End-to-end truck repair management software with automation, digital vehicle inspections, and multi-branch scalability for auto repair businesses.

Built a real-time payment analytics platform for the Govt aided platforms with workflow automation solutions and multilingual workflow automation capabilities.

Cloud-based tanning salon software with POS, booking, automation, and analytics to streamline operations and boost customer retention.

ASAM-based addiction management software for treatment centers. Streamline substance abuse treatment with structured care plans and integrated billing.

Azure-hosted court case management software enabling secure workflows, real-time data sync, and streamlined inter-agency coordination.

A secure, mobile-first offender case management platform with GPS tracking, secure messaging, and automation to boost compliance and transparency.

Automotive lending software automating dealer loan workflows with real-time integrations, fee validation, and instant approvals for faster financing.

AI-driven legal document automation software with clause libraries, logic management, and CLM integration—boosting accuracy, compliance, and speed.

We developed a construction safety management platform with real-time risk tracking, gamification, and offline access for high-risk industries.

Discover a cloud-based POS and retail ERP system unifying HR, inventory, ticketing, and training—built for multi-store retail business efficiency.

A centralized SaaS platform for motorcycle and powersports dealers—streamlining sales, financing, insurance, and trade-ins for faster deal closures.

HIPAA-compliant behavioral health EHR software streamlining clinical, billing, and intake workflows for mental health, recovery, and human services providers.

A scalable cloud-based claims administration platform for TPAs, insurers, and Medicare providers—streamlining onboarding, processing, and analytics.

Scalable fintech app for currency exchange, forex cards, and remittances—delivering automation, compliance, and real-time global transactions.

AI-powered online education platform with interactive eTextbooks, adaptive assessments, and real-time analytics to boost engagement and readiness.

SaaS-based event ticketing software development with secure seat selection, Stripe payments, and real-time check-ins for modern online event management.

Discover how our SMS automation software and referral marketing platform helped small businesses boost acquisition, loyalty, and ROI.

Explore remote patient monitoring software for chronic care, behavioral health, and transitional care compliant, scalable, and patient-focused.

Automated rental management system with online rental booking software to boost efficiency, bookings, and customer experience for rental businesses.

Boost florist sales with our SaaS eCommerce platform for B2B & B2C. POS, CRM, and mobile tools streamline operations and enhance customer retention.

Custom fintech app unifying 100+ services into a B2B/B2C fintech solution with real-time visibility and automated workflows.

Enterprise SaaS for automated billing with RBAC implementation and single sign-on integration, boosting accuracy, governance, and global finance workflows.

Streamline rentals with tenant management software, AI in property management, and proptech software development for smarter real estate operations.

Scalable wellness app development with appointment scheduling API, secure user authentication, and health metrics dashboard for measurable outcomes.

Custom cloud-based fitness app with virtual coaching, workout tracking, nutrition plans, and goal-driven features for trainers, users, and admins.

Scalable UGC marketplace app with escrow, FedEx, licensing & analytics—built by an expert marketplace app development company for secure brand-creator campaigns.

HIPAA-compliant AI telehealth app with computer vision for MSK care, real-time motion tracking, pain mapping, and remote patient monitoring.

IoT-driven smart greenhouse automation with climate control, soil moisture sensors, and Hortimod OS for precision agriculture and higher yields.

Custom AI face recognition software with biometric security, legal takedowns, and verified access to safeguard digital privacy and identity.

HIPAA-compliant on-demand marketplace for therapy with real-time scheduling, secure profiles, and scalable open-source software for therapists.

A smart parking solutions with real-time search, booking, and payments. Scalable parking management system for drivers, hosts, and admins.

Discover trusted medical treatment abroad with our medical tourism platform, offering secure bookings, consultations, and global care coordination.

AI-powered marijuana detection device with VR-based eye tracking, automated sobriety test workflows, and secure video processing for compliance.

A creative scorebook collaboration platform with real-time notation, event integration, and multi-device access—built for musicians, educators, and ensembles.

AI-powered mental wellness app with 24/7 emotional support, mood tracking, habit coaching, and secure analytics for scalable mental health care.

AI-powered smart farm monitoring system with ammonia sensor barn tracking, real-time alerts, and predictive insights for safer, compliant operations.

Secure business workflow automation software integrating offender case management, financial account handling, and digital process automation services.

Cloud-based CRE marketing software with online real estate BOV module, MLS integration, and marketing automation for faster property deals.

ASAM-based addiction management software for treatment centers. Streamline substance abuse treatment with structured care plans and integrated billing.

Azure-hosted court case management software enabling secure workflows, real-time data sync, and streamlined inter-agency coordination.

AI-powered smart farm monitoring system with ammonia sensor barn tracking, real-time alerts, and predictive insights for safer, compliant operations.

Discover a SaaS fintech platform on Azure that streamlines loan management, lender integration, and financing workflows, delivering instant approvals and enhanced customer experience.

Discover a cloud-based POS and retail ERP system unifying HR, inventory, ticketing, and training—built for multi-store retail business efficiency.

Cloud-native IoT tracking system with GPS, video intelligence, and remote device control for scalable, future-ready asset management across industries.

Enterprise SaaS IoT asset tracking software for security operations with real-time monitoring, incident reporting, and mobile-ready dashboards.

A scalable cloud-based claims administration platform for TPAs, insurers, and Medicare providers—streamlining onboarding, processing, and analytics.
Let’s turn your vision into an intelligent, scalable IoT solution tailored for energy efficiency, real-time insights, and operational excellence.
Click to Connect