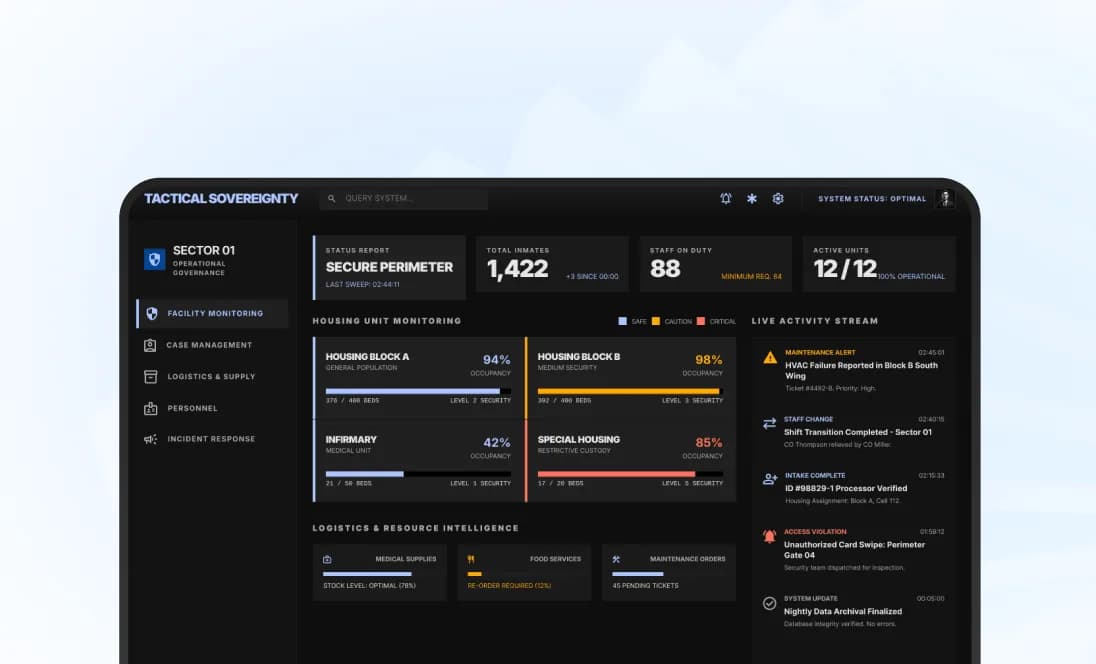


Live Data Feeds
Connected APIs feed the platform with current operational data, and dashboard views refresh every minute. Users can observe changing indicators without requesting or preparing new reports.
180 IT brings government operational data into one live monitoring platform. Executives and teams can track transactions, spot incidents, explore performance trends, and make timely decisions through dashboards designed for nontechnical users.

180 IT is a cloud-based monitoring and analytics platform developed for government departments, executives, and policymakers. It collects data from connected systems through APIs and presents operational information in interactive dashboards, charts, gauges, and drill-down reports. Dashboard views refresh every minute, while hourly aggregation manages traffic and supports efficient reporting. By bringing transactions, incidents, and performance indicators together, the platform replaces delayed spreadsheet-based reporting with a more consistent view of activity. Straightforward navigation helps users understand complex data and investigate issues without depending on technical teams.

Disconnected government systems and manually prepared Excel reports delayed access to operational information. Decision-makers lacked a consistent, current picture of performance across departments and reporting cycles.

Failed and pending transactions were difficult to identify within fragmented reports. Teams could miss emerging incidents or spend too long locating the information needed to investigate.

Inconsistent report formats made comparisons across departments harder. Executives and policymakers needed complex operational data presented clearly enough to interpret and act upon without technical assistance.

Manual data collection and aggregation consumed analyst time and slowed reporting. Growing data volumes increased the need for a process that could scale without excessive overhead.
Information from existing government systems needed to be connected without disrupting operational workflows. The platform required an API architecture that could accommodate future sources and requirements.
Without a centralized monitoring environment, teams struggled to review long-term trends alongside current activity. Stakeholders needed dependable access to performance indicators and detailed supporting records.
DITS developed a centralized, API-driven platform that turns operational data into timely, usable insight. Automated ingestion, scheduled aggregation, interactive reporting, and a scalable cloud architecture support day-to-day monitoring and longer-term governance decisions.

An API ingestion engine collects information from connected systems and refreshes dashboard views every minute. Stakeholders can review changing activity without waiting for manually assembled reports.

Operational data from multiple sources appears in one platform. Teams can track transactions, incidents, departmental activity, and performance indicators through a consistent view of current operations.

Scheduled hourly aggregation reduces repeated processing and helps manage API traffic. This approach supports efficient reporting while preserving the frequent dashboard updates needed for operational awareness.

Charts, gauges, compact trends, and drill-down views present complex data in approachable formats. Executives can understand high-level performance and explore details when an indicator warrants attention.

ASP.NET Core and REST APIs provide a foundation for connecting existing government systems. The extensible architecture supports additional data sources and growing operational reporting requirements.

The cloud-first SaaS design gives authorized teams centralized access to dashboards and reporting workflows. It supports continuous monitoring and provides room for future government data integrations.
The platform combines live data collection with visual tools that make operational performance easier to understand. Its features support quick executive review, detailed investigation, consistent departmental reporting, and continued system expansion.
Connected APIs feed the platform with current operational data, and dashboard views refresh every minute. Users can observe changing indicators without requesting or preparing new reports.

Hourly aggregation consolidates incoming information to manage processing demands and API traffic. It supports regular reporting while allowing frequently refreshed views of current operational activity.

One dashboard brings together performance indicators, incidents, trends, and failed or pending transactions. Executives and operational teams can begin their review from a shared information source.

An Angular interface offers responsive, point-and-click navigation for executives, policymakers, analysts, and operational teams. Users can explore reports without needing to work directly with raw datasets.

Highcharts powers interactive charts and comparisons. Sparklines show compact trends, solid gauges present KPIs against thresholds, and sunburst charts reveal relationships within hierarchical departmental data.

Drill-down reports let users move from summary indicators to detailed records. Selected 3D charts provide another view of complex datasets where that presentation supports interpretation.
Transaction and incident views surface failed or pending activity for closer review. Teams can locate concerning patterns and investigate issues using the underlying operational information.
Automatically updated dashboards replace manually consolidated Excel reports. Reusable chart templates help departments present information consistently and reduce repeated manual work across regular reporting cycles.
ASP.NET Core, Web API, RESTful integrations, and JSON data exchange connect existing systems to a cloud-first SaaS platform designed to accommodate additional workflows and sources.
Dashboard refreshes in under one minute contributed to a reported 90% reduction in data latency, helping departments identify changing conditions sooner than spreadsheet-based reporting allowed.
Centralized dashboards and automated reporting contributed to a reported 75% improvement in reporting efficiency, reducing the effort required to prepare and consolidate departmental Excel reports.
Visibility into failed and pending transactions supported a reported 85% accuracy in incident detection, giving operational teams clearer information for investigating and resolving emerging issues.
Automated ingestion, aggregation, and dashboard updates delivered a reported 70% automation in data processing, reducing repetitive analyst work across departments while supporting more frequent, consistent reporting.
Executives and policymakers can review the same current indicators and explore the details behind them, supporting more informed conversations about operational performance and departmental priorities.
A centralized API and cloud architecture provide a foundation for integrating additional government systems, extending monitoring coverage, and adapting reports as future governance needs evolve.

Secure business workflow automation software integrating offender case management, financial account handling, and digital process automation services.
View Project