DITS Logo
Connect With Us
IoT-Based Smart Power Monitoring System

IoT-Based Smart Power Monitoring System

Energy and Utilities | IoT, Angular, NestJS, MongoDB, MQTT, AWS through a secure, scalable, and connected digital environment across connected operations across connected operations across connected operations across connected operations.

IoT-Based Smart Power Monitoring System

Project Overview

We developed an enterprise-grade IoT smart power monitoring system that gives commercial, educational, and industrial facilities real-time visibility into utility usage. The cloud-enabled solution consolidates more than 2,500 data points from electricity, water, gas, steam, solar, heat-source, and environmental sensors into one operational environment. Designed for facility managers, energy teams, analysts, and administrators, the platform combines live dashboards, socket-based updates, advanced analytics, device grouping, power-quality monitoring, configurable reporting, and secure role-based access. Organizations can examine consumption by building, floor, zone, department, group, or individual device to identify waste, manage costs, support compliance, and improve sustainability decisions. The solution also serves.

Challenges Faced by Business

  • Rising operational costs

    Rising operational costs

    Unmonitored and inefficient consumption patterns allowed avoidable energy waste to continue, increasing utility expenses across coordinated business and operational workflows across connected operations across connected.

  • No live visibility into wastage

    No live visibility into wastage

    Without real-time tracking, teams could not detect sudden spikes, irregular usage, or emerging issues early enough to intervene across coordinated business and operational workflows across.

  • Limited benchmarking across facilities

    Limited benchmarking across facilities

    The absence of a unified building, floor, zone, and equipment view made audits and performance comparisons difficult across coordinated business and operational workflows across connected.

  • Insufficient reporting

    Insufficient reporting

    Teams lacked granular, configurable reports for compliance, consumption analysis, performance reviews, and optimization planning across coordinated business and operational workflows across connected operations across connected.

  • No immediate anomaly alerts

    No immediate anomaly alerts

    Decision-makers could not react promptly to threshold breaches, increasing the risk of overconsumption, equipment stress, or operational leakage across coordinated business and operational workflows across.

  • Fragmented multi-utility management

    Fragmented multi-utility management

    Electricity, solar, water, gas, and steam data were handled separately, preventing a complete view of utility performance across coordinated business and operational workflows across connected.

Solutions Provided by Ditstek

Ditstek brought fragmented meter and sensor data into a centralized, cloud-enabled platform designed for continuous monitoring, structured analytics, and secure operational control across secure and scalable digital operations across connected.

Centralized Utility Data Platform

Centralized Utility Data Platform

Unified more than 2,500 live data points from electricity, water, gas, steam, solar, power meters, and environmental sensors across coordinated business and operational workflows across.

Interactive energy dashboards

Interactive energy dashboards

Presented consumption, cost, carbon-footprint, and performance data through gauges, line charts, bar graphs, pie charts, and odometers across coordinated business and operational workflows across connected.

Configurable reporting engine

Configurable reporting engine

Enabled 10-minute, 30-minute, hourly, daily, and monthly reporting with PDF and CSV exports for audits and operational reviews across coordinated business and operational workflows across.

Configurable reporting engine

Configurable reporting engine

Enabled 10-minute, 30-minute, hourly, daily, and monthly reporting with PDF and CSV exports for audits and operational reviews across coordinated business and operational workflows across.

Real-time monitoring architecture

Real-time monitoring architecture

Used MQTT, WebSockets, and Socket.IO to keep dashboards continuously updated and support rapid responses to anomalies across coordinated business and operational workflows across connected operations.

Role-based operational access

Role-based operational access

Provided controlled views and permissions for building administrators, facility managers, analysts, and other stakeholder groups across coordinated business and operational workflows across connected operations across.

Device hierarchy and grouping

Device hierarchy and grouping

Organized meters and sensors by facility, building, floor, zone, department, group, and device for contextual analysis across coordinated business and operational workflows across connected operations.

Resilient backup and recovery

Implemented backup, error-recovery, and restoration capabilities to protect large operational datasets and support continuity across coordinated business and operational workflows across connected operations across connected.

Datapoint lifecycle management

Enabled discovery, registration, property comparison, synchronization, updating, drag-and-drop mapping, and unregistering of connected datapoints across coordinated business and operational workflows across connected operations across connected.

Frontend modernization

Resolved chart responsiveness and Gridster compatibility issues while upgrading Angular dependencies, addressing CSS regressions, package vulnerabilities, and TypeScript typing across coordinated business and operational workflows.

Platform Features

Real-Time Energy Monitoring

Real-Time Energy Monitoring

Track energy consumption in real time using IoT from over 2,500 connected power meters and environmental sensors. This smart energy monitoring system using IoT enables instant visibility, helping facilities proactively reduce waste and improve efficiency.

Hierarchical Data Access

Hierarchical Data Access

Access energy data at every organizational level—building, floor, zone, group, or device. This multi-layered structure ensures contextual insights for every stakeholder, from corporate sustainability teams to local building managers.

Interactive Modular Dashboards

Interactive Modular Dashboards

Visualize usage and trends with configurable dashboards featuring gauge meters, line charts, bar graphs, pie charts, and odometers. Users can monitor consumption and cost patterns intuitively, tailored to their preferences and operational needs.

Custom Reporting Engine

Custom Reporting Engine

Generate detailed reports at customizable intervals—10 minutes, 30 minutes, hourly, daily, or monthly. This feature ensures timely insights for audits, performance evaluations, and energy-saving initiatives across departments.

Multi-Format Report Export

Multi-Format Report Export

Export data-rich reports in PDF or CSV formats. Choose from a single-page overview or full dataset exports for sharing, compliance tracking, or deeper analysis of your energy footprint.

MQTT & WebSocket Integration

MQTT & WebSocket Integration

Ensure uninterrupted real-time updates through MQTT and WebSocket integration. These technologies keep dashboards and data views live, empowering instant decision-making based on current energy metrics.

Role-Based User Access

Role-Based User Access

Control platform access securely with role-based permissions for Admins, Analysts, and Viewers. This ensures users see only relevant data while maintaining compliance, governance, and confidentiality across organizational tiers.

Sensor Management Dashboard

Sensor Management Dashboard

Easily manage all IoT-connected devices through a unified sensor management module. Instantly view sensor types, status, and connectivity to ensure smooth operations across your energy monitoring infrastructure.

Device Grouping & Hierarchy Builder

Device Grouping & Hierarchy Builder

Organize and categorize devices using a drag-and-drop interface. This flexible structure enhances usability, simplifies analytics, and supports expansion into new facilities or meter types with minimal setup.

Real-Time Alerts & Notifications

Real-Time Alerts & Notifications

Receive instant alerts for energy spikes, anomalies, or threshold breaches. This feature helps teams respond quickly, prevent overconsumption, and maintain operational stability through proactive energy management.

System Backup & Restore

System Backup & Restore

Safeguard critical energy data with secure backup and restore features. Supports large data sets and memory-safe processing, ensuring business continuity and rapid recovery from unexpected issues.

Custom Dashboard Layouts

Custom Dashboard Layouts

Design your own dashboards using a Gridster2-based layout builder. This flexibility allows users to create tailored views that align with their operational focus and energy tracking priorities.

Power Quality Monitoring

Power Quality Monitoring

Monitor voltage fluctuations, harmonics, and load imbalances with complete power quality analytics. This capability improves equipment protection, reduces downtime, and enhances visibility across the smart energy monitoring system using IoT.

Enterprise-Grade Scalability

Enterprise-Grade Scalability

Built as a modular, scalable IoT based energy monitoring system, the platform adapts to growing enterprise needs across multi-site, multi-utility environments with ease, performance, and reliability.


Impact Created

70 Percent Faster Anomaly Detection

70 Percent Faster Anomaly Detection

Live monitoring, threshold alerts, and connected dashboards helped operational teams identify unusual consumption patterns earlier and respond before irregular usage developed into larger issues across.

Up to 35 Percent Less Energy Waste

Up to 35 Percent Less Energy Waste

Centralized utility visibility, comparisons, and actionable reporting helped teams recognize inefficient consumption and make more informed decisions supporting cost control and long-term sustainability across coordinated.

40 Percent Faster Reporting

40 Percent Faster Reporting

Automated reporting and scheduled exports reduced dependence on manual logs, accelerated operational reviews, and made energy information easier to share across authorized teams and locations.

More Portfolios

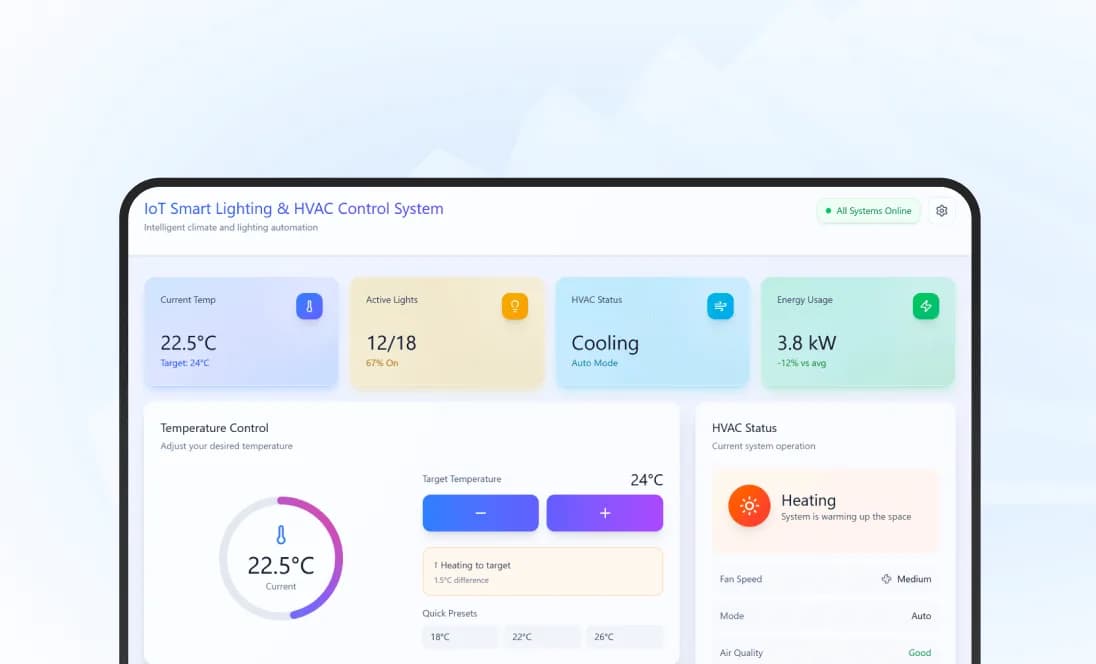
IoT Smart Lighting & HVAC Control System

Smart IoT lighting and HVAC control system with QR code access control and real-time energy management for efficient building operations.

View Project
IoT Smart Lighting & HVAC Control System

Got a Question or a Project in Mind?

Drop your query below, and let's explore how we can collaborate to drive engagement, visibility, and measurable results.